Modification of my bulk update home drive script.
# CHANGE LOGON SCRIPT
Import-Module ActiveDirectory
Get-ADUser -Filter * -SearchBase "OU=Users,DC=contoso,DC=com" | Foreach-Object{
$sam = $_.SamAccountName
Set-ADuser -Identity $_ -ScriptPath "LOGON-NEW.bat"
}
Friday, June 19, 2015

Active Directory: Bulk Update Home Folder Path
Can't take any credit for this one. Just happened to stumble on it in a forum post. Just putting it here for future reference. Added a couple of checks for good measure.
# CHANGE HOME DIRECTORY
$SearchOU="OU=Users,DC=contoso,DC=com"
Import-Module ActiveDirectory
#Search for all users in OU that are not disabled or with blank homedirectory
Get-ADUser -Filter * -SearchBase $SearchOU | where-object {$_.enabled -eq $true -AND $_.homedirectory -ne ""} | Foreach-Object
{
$sam = $_.SamAccountName
Set-ADuser -Identity $_ -HomeDrive "H:" -HomeDirectory \\SERVER02\Users\$sam
}
# CHANGE HOME DIRECTORY
$SearchOU="OU=Users,DC=contoso,DC=com"
Import-Module ActiveDirectory
#Search for all users in OU that are not disabled or with blank homedirectory
Get-ADUser -Filter * -SearchBase $SearchOU | where-object {$_.enabled -eq $true -AND $_.homedirectory -ne ""} | Foreach-Object
{
$sam = $_.SamAccountName
Set-ADuser -Identity $_ -HomeDrive "H:" -HomeDirectory \\SERVER02\Users\$sam
}
Tuesday, March 24, 2015
SBS + DirSync for Office365
Learned today that SBS still doesn't support DirSync. You can install it on a domain controller which didn't used to be the case. So the requirement remains 2008/2012, including DCs. No SBS 2011 (what I was trying in this case).
I haven't seen any information to suggest anyone has gotten it to work. Feel free to share your experience if you have. My assumption is that SBS being a different beast with its extra SQL Express and such just can't do it.
Wednesday, August 27, 2014
Cisco RADIUS Authentication w/ Active Directory and Network Policy Server
I'll try to keep this short and sweet. It took me a bit to find the exact commands I used. The configuration below has been validated to work on Cisco routers, switches, and voice gateways.
Part 1. RADIUS Server Configuration
Assuming you already have a Network Policy Server installed on a DC somewhere...RADIUS Clients and Servers > RADIUS Clients > Right Click > New RADIUS Client
- Add Friendly Name
- IP
- Vendor = Cisco
- Shared Secret
- Manual
- Enter a key (same as used on the cisco device)
- Policy Name (I just called this the same as the client friendly name)
- Conditions
- Windows Groups: AD Group with network administrator accounts
- Client Friendly Name: same as friendly from "RADIUS Clients" (prevents policies from inadvertently being applied to the wrong devices. Optional precaution)
- Authentication Methods > Check "Unencrypted authentication"
- "Configure Settings"
- RADIUS Attributes
- Standard > Remove Framed-Protocol PPP
- Vendor Specific > Add (allows user to launch in to enable mode by default)
- Vendor = Cisco
- Attribute Name = Cisco-AV-Pair
- Value = shell:priv-lvl=15
Part 2: SSH to Cisco Switch/Router
You'll need...- VLAN/IP that authentication will originate from
- IP of your RADIUS Server
- RADIUS Secret used in part 1.
aaa new-model
aaa authentication login default group radius local
aaa authorization exec default group radius local
ip radius source-interface <<VLAN/IP>> Interface (e.g. Vlan1 or GigabitEthernet0/0)
radius-server host <<IP of RADIUS Server>> auth-port 1645 acct-port 1646
radius-server key <<RADIUS SECRET>>
service password-encryption
Part 3: Testing
- Ensure your admin account can log in
- Ensure that other accounts cannot log in. Especially if you have other RADIUS auth policies like we did.
- Validate that your local account no longer works by default.
- "Disable" your RADIUS client. Validate that your local account works as a fail safe.
Thursday, June 26, 2014
Task Scheduler Change Audit Trail
Background
Walked in today to some questions about why an important
scheduled tasks <cringe face here> had been disabled. Turned out that it
was intentional so no big deal. However, the question I was asked before we
knew it was intentional was this… “how do we see an audit trail for task
scheduler changes?” The short answer is that it’s not enabled by default and it’s
not super intuitive.
This has to be auditpol.exe
More Here
Auditing consists of categories and subcategories. To do
this you need to enable a subcategory. Technically, this is the recommended way
to enable non-standard auditing. You don’t want to audit too much or you’ll make
your log difficult to read, fill up space, consume processing time, etc. Per
Micrsoft…
If you are going to use auditing subcategories, you should not use
Group Policy to define and distribute your auditing policies. The Group Policy
Management Console configures only the top-level auditing categories and
enables all of the subcategories within the category and thus cannot be used to
set more targeted audit policy. Instead, auditing policy that uses auditing
subcategories must be defined by using the command-line tool auditpol.exe and
distributed by means of a script.
Execution
So how do I do that? Pretty simple:
From a command prompt:
auditpol.exe /get /category:"Object Access"
I can see that I'm currently set to all "Failure" only which inherited from the Local Policy parent "Object Access". I want to change "Other Object Access Events" which is sort of a misc set of audit events for Task Scheduler and COM+.
All of that to say, here is the command to enable Task Scheduler auditing to the Event Viewer Security logs.
auditpol.exe /set /subcategory:"Other Object Access Events" /Success:Enabled /Failure:Enabled

You can verify your change in the Security log. Event ID 4719.

So I went and disabled/enabled a scheduled task. Now I can see these logs.


We use System Center Operations Manager. So at this point I could capture on the various event IDs (also in the link above) that this new audit log will generate.
Hopefully this will shortcut the process for you. As you can see, I had to pull together a few resources to understand what I really needed.
Wednesday, April 2, 2014
Grant Access to Specific Runbooks in Orchestrator
Since I had a hard
time finding a clear guide on the topic here goes...
As a systems
administrator / domain admin I typically have access to just about any system.
As such, no big deal for me to be in the "users" group recommended
for the initial Orchestrator install. This group is a bit of a misnomer. These
are your designers. So in my case I have a group called “app-scorch-users”
which consists for systems administrators.
So the issue is, how
to provide runbooks specific to other roles. I want my DBA, developers, and
so on to be able to execute their runbooks from the web console with ease but
only those we choose. i.e. DBAs can’t run developers runbooks.
- I started by creating a domain group: app-scorch-operators. Anyone who will run (not design) runbooks will go in this group.
- Add that group to the root Runbooks container (right click > permissions)
- Restrict its access to "read"
- Go to Advanced > Select the group > change "Applies to:" to "This object only"
The purpose of the
operators group is simply to grant access to read objects under the “Runbooks”
node in the connections pane.


This opens up the
ability to assign perms to users/group on the subfolders or directly to
runbooks. In this example, I am attempting to grant several individuals to a
folder (you could create domain groups per folder too).
- So I'll go to the "Patching" folder > Right click > Permissions
- Add any users or groups you'd like to execute runbooks with ONLY Read

- Once added, you'll need to add one more thing…."Publish". Otherwise you'll get an error stating the user must have publish to run a runbook.
- Go to Advanced > Edit > "Show advanced permissions"
- Read properties and list contents will already be checked.

Now when your
"Operators" go to the web Orchestrator Console they'll only see the
folders where they were granted read/publish. (note below SC2012 Solutions from
the first screenshot is not displayed)

Wednesday, November 13, 2013
SCOM Unit Monitor Based on Memory Percentage %
There technically isn't a perf counter for memory % used/free. You can use the following counters from the Windows Server management packs. They're very good indicators for memory pressure. However, if you want to just know when servers have violated a basic percentage of installed physical memory you have to build your own scripted unit monitor.
In researching this I stumbled on a forum post here.
I highjacked most of this script but made some alterations to leverage more out of the box SCOM functionality.
Take the following script and build a Time Script Three State Monitor (see below)
\\\\\\\\\\\\\\\\\\\\\\\\\\\\\\\\\\\\\\\\\\\\\\\\\\\\\\\\\\\\\\\\\\\\\\\\\\\\\\\\\\\\\\\\\\\\\\\\\\\
Option Explicit
Dim oAPI, oBag, oArgs
Dim objWMIService, objItem, colItems
Dim strComputer, strList
Dim memused, mempercent
Set oAPI = CreateObject("MOM.ScriptAPI")
Set oBag = oAPI.CreatePropertyBag()
Set oArgs = WScript.Arguments
On Error Resume Next
strComputer = "."
set objWMIService = GetObject("winmgmts:\\" _
& strComputer & "\root\cimv2")
set colItems = objWMIService.ExecQuery _
("Select * from Win32_OperatingSystem")
For Each objItem in colItems
memused = objItem.TotalVisibleMemorySize - objItem.FreePhysicalMemory
mempercent = memused/objItem.TotalVisibleMemorySize
mempercent = mempercent * 100
mempercent = Cint(mempercent)
Next
Call oBag.AddValue("Percent",mempercent)
Call oAPI.Return(oBag)
\\\\\\\\\\\\\\\\\\\\\\\\\\\\\\\\\\\\\\\\\\\\\\\\\\\\\\\\\\\\\\\\\\\\\\\\\\\\\\\\\\\\\\\\\\\\\\\\\\\


Be careful when setting your schedule. I have a fairly aggressive schedule here. This is a fairly light script but the cummulative of monitors can add up to impact performance.

Paste the script above into the script field. Set a file name with a .vbs extension.

Configure your preferred thresholds.


I'm setting a pretty generic override for 2008 Computer Group.


In researching this I stumbled on a forum post here.
I highjacked most of this script but made some alterations to leverage more out of the box SCOM functionality.
Take the following script and build a Time Script Three State Monitor (see below)
\\\\\\\\\\\\\\\\\\\\\\\\\\\\\\\\\\\\\\\\\\\\\\\\\\\\\\\\\\\\\\\\\\\\\\\\\\\\\\\\\\\\\\\\\\\\\\\\\\\
Option Explicit
Dim oAPI, oBag, oArgs
Dim objWMIService, objItem, colItems
Dim strComputer, strList
Dim memused, mempercent
Set oAPI = CreateObject("MOM.ScriptAPI")
Set oBag = oAPI.CreatePropertyBag()
Set oArgs = WScript.Arguments
On Error Resume Next
strComputer = "."
set objWMIService = GetObject("winmgmts:\\" _
& strComputer & "\root\cimv2")
set colItems = objWMIService.ExecQuery _
("Select * from Win32_OperatingSystem")
For Each objItem in colItems
memused = objItem.TotalVisibleMemorySize - objItem.FreePhysicalMemory
mempercent = memused/objItem.TotalVisibleMemorySize
mempercent = mempercent * 100
mempercent = Cint(mempercent)
Next
Call oBag.AddValue("Percent",mempercent)
Call oAPI.Return(oBag)
\\\\\\\\\\\\\\\\\\\\\\\\\\\\\\\\\\\\\\\\\\\\\\\\\\\\\\\\\\\\\\\\\\\\\\\\\\\\\\\\\\\\\\\\\\\\\\\\\\\

Best practice is to disable by default. Later you can set overrides for any monitor to enable it where applicable.

Be careful when setting your schedule. I have a fairly aggressive schedule here. This is a fairly light script but the cummulative of monitors can add up to impact performance.

Paste the script above into the script field. Set a file name with a .vbs extension.

Configure your preferred thresholds.


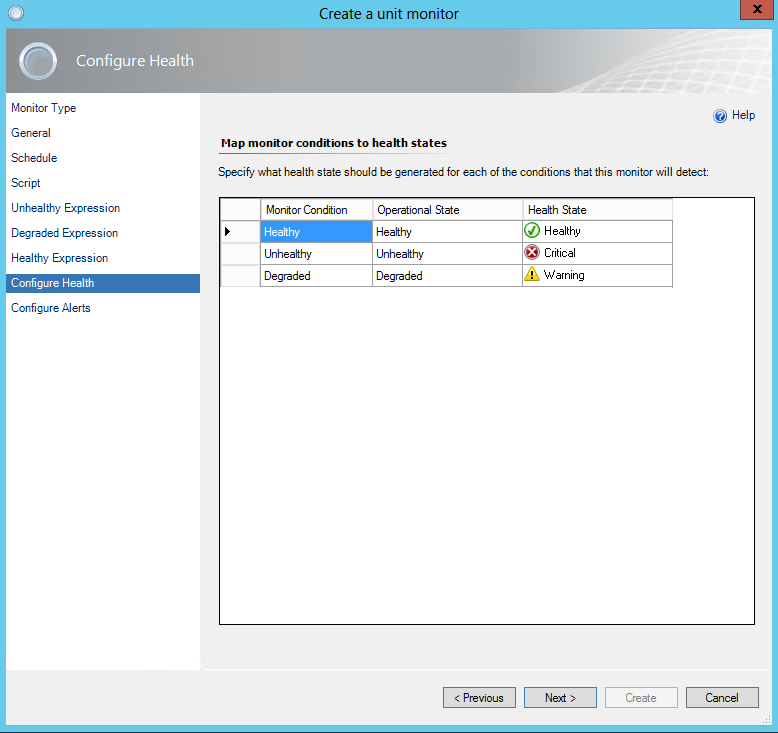
I'm setting a pretty generic override for 2008 Computer Group.


Friday, August 30, 2013
SCOM 2012 Percent Processor Time Report Blank
It's a bit of a cop out but the simple fix is to go get a different report. I've seen numerous posts about creating overrides, bringing in custom SSRS reports, etc. etc. In my case I'm running v.6.0.7026.0 of the core OS MP. For whatever reason I couldn't get that report to work. "Performance History (Percent Processor Time)" is always blank. I tried all the variations of overrides and temp rules to get Processor vs. Processor Information...it was a pain.


After chasing this for days I saw a post that suggested getting the latest reports. What I ened up with was a different MP entirely. I grabbed the "Windows Server Operating System Reports"

This MP contains two reports. They are both able to display stats like CPU Average % Utilization, Memory Average % Physical Memory, and Logical Disk Average Disk Queue Length, and so on. I found the reports useful. This was a simple work around to get the stats I needed without having to correct Microsoft's blunder.


Wednesday, October 31, 2012
Installing Cisco Fabric Manager on Windows 7 x64
Installing Cisco Fabric Manager on Windows 7 x64
1. Download the latest version from the Cisco site.
Cisco MDS 9000 Family Management Software and Documentation CD-ROM - Image for vX
http://www.cisco.com/cisco/software/type.html?mdfid=282731430&catid=null
2. Download Java RE 1.6 - At the time of writing this the FM (4.2.9) software does not support Java RE 7.
http://www.filehippo.com/download_jre_32/13491/
3. Right click on Command Prompt > "Run as administrator"
> cd "c:\Program Files (x86)\java\jre6\bin"
(example command line)
> java.exe -Xmx512m -jar "C:\m9000-cd-4.2.9\software\m9000-fm-4.2.9.jar"
From there it's next - next - next.
-Shep
Thursday, July 5, 2012
Exchange: Mailbox and Database Storage Statistics PowerShell Export
Bear in mind this is version 1 so there aren't any variables to pass into yet. I'd like to get this a little more modular so you would adjust the command line instead of digging through the script for things like the mail server and such. Still, it does what I need it to. I'll highlight what you would need to update for your environment.
One tip for something I've done in the past. If you have SharePoint you can mail enable a library and email these to it. Then you capture the change in space over time so you know how your storage is changing. Plus it gets this valuable data out of your inbox.
This is particularly helpful when trying to right size your DBs and manage your various drives (typically it's best to put each DB on it's own drive letter).
#Gets mailbox statistics from specified mailbox server. Returns User, Size, Item Count, and which database the mailbox is in.
$MailboxStatsFileName="MailboxStats-" + $(get-date).tostring("MMddyyyy") + ".csv"
$MailboxStatsDeleteFileName="MailboxStats-" + $(get-date).adddays(-35).tostring("MMddyyyy") + ".csv"
Write-Output "Creating mailbox stats: $($MailboxStatsFileName)"
Get-MailboxStatistics -server ServerName | Select-Object DisplayName,@{label=”User”;expression={$_.LastLoggedOnUserAccount}},@{label=”Total Size(MB)”;expression={$_.TotalItemSize.Value.ToMB()}},ItemCount,Database | Export-CSV "C:\Reports\$($MailboxStatsFileName)"
#Pause to allow time for export
Start-Sleep 20
function Get-DatabaseStatistics {
$Databases = Get-MailboxDatabase -Status
foreach($Database in $Databases) {
$DBSize = $Database.DatabaseSize
$MBCount = @(Get-MailboxStatistics -Database $Database.Name).Count
$MBAvg = Get-MailboxStatistics -Database $Database.Name |
%{$_.TotalItemSize.value.ToMb()} |
Measure-Object -Average
New-Object PSObject -Property @{
Server = $Database.Server.Name
DatabaseName = $Database.Name
LastFullBackup = $Database.LastFullBackup
MailboxCount = $MBCount
"DatabaseSize (GB)" = $DBSize.ToGB()
"AverageMailboxSize (MB)" = $MBAvg.Average
"WhiteSpace (MB)" = $Database.AvailableNewMailboxSpace.ToMb()
}
}
}
#Runs function to gather server/database stats including whitespace
$DBFileName="DBStats-" + $(get-date).tostring("MMddyyyy") + ".csv"
$DBDeleteFileName="DBStats-" + $(get-date).adddays(-35).tostring("MMddyyyy") + ".csv"
Write-Output "Creating DB stats: $($DBFileName)"
Get-DatabaseStatistics | Export-Csv "C:\Reports\$($DBFileName)" -Force -NoType
#Pause to allow time for export
Start-Sleep 15
Write-Output "Emailing: $($MailboxStatsFileName) and $($DBFileName) to sys admins"
#Send email to admins with report info for mailboxes and databases.
Send-MailMessage -To email@company.com -From Exchange@Company.com -Subject "Email Statistics for $((get-date).ToShortDateString())" -SmtpServer mail.company.com -Attachments "C:\Reports\$($MailboxStatsFileName)", "C:\Reports\$($DBFileName)"
if (test-path -Path "C:\Reports\$($MailboxStatsDeleteFileName)")
{
Write-Output "Deleting Old Mailbox Stats"
Remove-Item -Path "C:\Reports\$($MailboxStatsDeleteFileName)" -ErrorAction SilentlyContinue
}
if (test-path -Path "C:\Reports\$($DBDeleteFileName)")
{
Write-Output "Deleting Old DB Stats"
Remove-Item -Path "C:\Reports\$($DBDeleteFileName)" -ErrorAction SilentlyContinue
}
One tip for something I've done in the past. If you have SharePoint you can mail enable a library and email these to it. Then you capture the change in space over time so you know how your storage is changing. Plus it gets this valuable data out of your inbox.
This is particularly helpful when trying to right size your DBs and manage your various drives (typically it's best to put each DB on it's own drive letter).
#Gets mailbox statistics from specified mailbox server. Returns User, Size, Item Count, and which database the mailbox is in.
$MailboxStatsFileName="MailboxStats-" + $(get-date).tostring("MMddyyyy") + ".csv"
$MailboxStatsDeleteFileName="MailboxStats-" + $(get-date).adddays(-35).tostring("MMddyyyy") + ".csv"
Write-Output "Creating mailbox stats: $($MailboxStatsFileName)"
Get-MailboxStatistics -server ServerName | Select-Object DisplayName,@{label=”User”;expression={$_.LastLoggedOnUserAccount}},@{label=”Total Size(MB)”;expression={$_.TotalItemSize.Value.ToMB()}},ItemCount,Database | Export-CSV "C:\Reports\$($MailboxStatsFileName)"
#Pause to allow time for export
Start-Sleep 20
function Get-DatabaseStatistics {
$Databases = Get-MailboxDatabase -Status
foreach($Database in $Databases) {
$DBSize = $Database.DatabaseSize
$MBCount = @(Get-MailboxStatistics -Database $Database.Name).Count
$MBAvg = Get-MailboxStatistics -Database $Database.Name |
%{$_.TotalItemSize.value.ToMb()} |
Measure-Object -Average
New-Object PSObject -Property @{
Server = $Database.Server.Name
DatabaseName = $Database.Name
LastFullBackup = $Database.LastFullBackup
MailboxCount = $MBCount
"DatabaseSize (GB)" = $DBSize.ToGB()
"AverageMailboxSize (MB)" = $MBAvg.Average
"WhiteSpace (MB)" = $Database.AvailableNewMailboxSpace.ToMb()
}
}
}
#Runs function to gather server/database stats including whitespace
$DBFileName="DBStats-" + $(get-date).tostring("MMddyyyy") + ".csv"
$DBDeleteFileName="DBStats-" + $(get-date).adddays(-35).tostring("MMddyyyy") + ".csv"
Write-Output "Creating DB stats: $($DBFileName)"
Get-DatabaseStatistics | Export-Csv "C:\Reports\$($DBFileName)" -Force -NoType
#Pause to allow time for export
Start-Sleep 15
Write-Output "Emailing: $($MailboxStatsFileName) and $($DBFileName) to sys admins"
#Send email to admins with report info for mailboxes and databases.
Send-MailMessage -To email@company.com -From Exchange@Company.com -Subject "Email Statistics for $((get-date).ToShortDateString())" -SmtpServer mail.company.com -Attachments "C:\Reports\$($MailboxStatsFileName)", "C:\Reports\$($DBFileName)"
if (test-path -Path "C:\Reports\$($MailboxStatsDeleteFileName)")
{
Write-Output "Deleting Old Mailbox Stats"
Remove-Item -Path "C:\Reports\$($MailboxStatsDeleteFileName)" -ErrorAction SilentlyContinue
}
if (test-path -Path "C:\Reports\$($DBDeleteFileName)")
{
Write-Output "Deleting Old DB Stats"
Remove-Item -Path "C:\Reports\$($DBDeleteFileName)" -ErrorAction SilentlyContinue
}
Exchange: Mailbox Database Whitespace
Get-MailboxDatabase
-status | select-object name,availablenewmailboxspace
I may have to look at combining this with another post for exporting mailbox and DB storage stats. Either as another value on that dump or another csv to email out.
Exchange: Bulk Mailbox Database Migrations
AUTO SUSPEND
$targetDB="DATABASENAME"
$users = Import-Csv C:\Mailbox\Move.csv
foreach
($user in $users)
{
Write-Output "Processing User: $($user.UserName) at $(get-date)"
Get-Mailbox -Identity $user.UserName|
New-MoveRequest -BatchName 'MyBatchName' -SuspendWhenReadyToComplete
-TargetDatab5ase "$($targetDB)" -BadItemLimit 5
Write-Output "Finished Processing User: $($user.UserName) at $(get-date)"
}
NO SUSPEND
$targetDB="DATABASENAME"
$users = Import-Csv C:\Mailbox\Move.csv
foreach
($user in $users)
{
Write-Output "Processing User: $($user.UserName) at $(get-date)"
Get-Mailbox -Identity $user.UserName
| New-MoveRequest -BatchName 'MyBatchName' -TargetDatabase
"$($targetDB)" -BadItemLimit 5
Write-Output "Finished Processing User: $($user.UserName) at $(get-date)"
}
Some other helpful one liners to go with the previous scripts.
Get-MoveRequest -MoveStatus 'InProgress' -BatchName
'MyBatchName'
Get-MoveRequest -MoveStatus 'AutoSuspended' -BatchName
'MyBatchName'
Get-MoveRequest -MoveStatus 'CompletionInProgress'
-BatchName 'MyBatchName'
Get-MoveRequest -MoveStatus 'AutoSuspended' -BatchName
'MyBatchName' | Resume-MoveRequest
Exchange: Message from an Address for Time Period
Just a quick one liner
Get-MessageTrackingLog -ResultSize unlimited –Sender “address@company.com” -Start "6/21/2012 12:00AM" -End "6/22/2012 7:50AM" | Export-CSV C:\commadelimitedoutput.csv
Get-MessageTrackingLog -ResultSize unlimited –Sender “address@company.com” -Start "6/21/2012 12:00AM" -End "6/22/2012 7:50AM" | Export-CSV C:\commadelimitedoutput.csv
Subscribe to:
Posts (Atom)