In researching this I stumbled on a forum post here.
I highjacked most of this script but made some alterations to leverage more out of the box SCOM functionality.
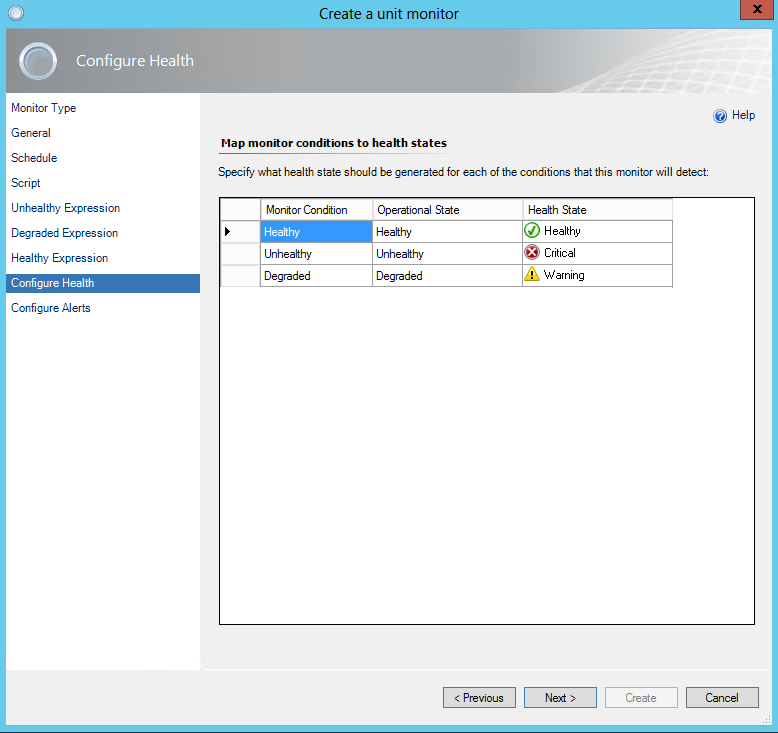
Take the following script and build a Time Script Three State Monitor (see below)
\\\\\\\\\\\\\\\\\\\\\\\\\\\\\\\\\\\\\\\\\\\\\\\\\\\\\\\\\\\\\\\\\\\\\\\\\\\\\\\\\\\\\\\\\\\\\\\\\\\
Option Explicit
Dim oAPI, oBag, oArgs
Dim objWMIService, objItem, colItems
Dim strComputer, strList
Dim memused, mempercent
Set oAPI = CreateObject("MOM.ScriptAPI")
Set oBag = oAPI.CreatePropertyBag()
Set oArgs = WScript.Arguments
On Error Resume Next
strComputer = "."
set objWMIService = GetObject("winmgmts:\\" _
& strComputer & "\root\cimv2")
set colItems = objWMIService.ExecQuery _
("Select * from Win32_OperatingSystem")
For Each objItem in colItems
memused = objItem.TotalVisibleMemorySize - objItem.FreePhysicalMemory
mempercent = memused/objItem.TotalVisibleMemorySize
mempercent = mempercent * 100
mempercent = Cint(mempercent)
Next
Call oBag.AddValue("Percent",mempercent)
Call oAPI.Return(oBag)
\\\\\\\\\\\\\\\\\\\\\\\\\\\\\\\\\\\\\\\\\\\\\\\\\\\\\\\\\\\\\\\\\\\\\\\\\\\\\\\\\\\\\\\\\\\\\\\\\\\

Best practice is to disable by default. Later you can set overrides for any monitor to enable it where applicable.

Be careful when setting your schedule. I have a fairly aggressive schedule here. This is a fairly light script but the cummulative of monitors can add up to impact performance.

Paste the script above into the script field. Set a file name with a .vbs extension.

Configure your preferred thresholds.


I'm setting a pretty generic override for 2008 Computer Group.


